DATASET
Dataset Profile
A structured examination of dataset depth, coverage, and statistical properties across 80+ days of continuous collection.
01 Dataset at a Glance

02 Anatomy of a Single Row
row ─────────────────────────────────────────────────────────
│
├── symbol                                           (string)
├── snapshot_ts                                      (ISO 8601)
│
├── meta ─────────────────────────────────── 22 fields
│   ├── session_id (UUID v4)
│   ├── schema_version, scoring_version
│   ├── duration_sec, sample_count, total_samples
│   ├── universe tracking (page, snapshot_id, lag)
│   └── lifecycle timestamps (added, expires, expired)
│
├── spot_raw ─────────────────────────────── 19 fields
│   ├── mid, bid, ask, last, spread_bps
│   ├── range_pct_24h, ticker24_chg
│   ├── taker_buy_ratio_5m, obi_5
│   ├── depth_5bps_quote, depth_10bps_quote, depth_25bps_quote
│   ├── depth_bid_qty_quote, depth_ask_qty_quote
│   ├── micro_premium_pct, avg_impact_pct
│   └── spread_eff_raw, liq_eff_raw, liq_qv_usd
│
├── futures_raw ──────────────────────────── 10 fields
│   ├── contract, last_updated_ts, age_sec
│   ├── funding_now, funding_24h_mean
│   ├── open_interest, open_interest_5m_delta_pct
│   ├── basis_now_bps
│   └── top_long_short_accounts_5m, top_long_short_positions_5m
│
├── derived ──────────────────────────────── 9 fields
│   ├── depth_spread_bps, depth_weighted, depth_imbalance, depth_skew
│   ├── flow (0–100)
│   ├── liq_global_pct, liq_self_pct
│   └── spread_pct, spread_bps
│
├── scores ───────────────────────────────── 13 factors
│   ├── final (composite)
│   ├── mom, vol, str, liq, spread, taker, flow, depth, microstruct
│   └── spread_eff_score, liq_eff_score, compression_score
│
├── flags ────────────────────────────────── 12 fields
│   ├── spot_data_ok, futures_data_ok, twitter_data_ok
│   ├── futures_stale, futures_contract_exists
│   ├── mom_fallback, vol_fallback, spread_fallback
│   └── compression_enabled, pair_bonus_applied (float)
│
├── twitter_sentiment_windows
│   ├── last_cycle ───────────────────────── ~50 fields
│   │   ├── posts_total, posts_pos, posts_neu, posts_neg
│   │   ├── lexicon_sentiment → {scale, score}
│   │   ├── category_counts → {positive_general, negative_general,
│   │   │                       pump_hype, fud_fear, meme_slang,
│   │   │                       scam_rug, emoji_pos, emoji_neg}
│   │   ├── top_terms → {6 arrays of top-3 terms per category}
│   │   ├── platform_engagement → {likes, retweets, replies,
│   │   │                          quotes, bookmarks, impressions}
│   │   ├── author_stats → {distinct_total, distinct_blue,
│   │   │                    distinct_verified, followers_sum/
│   │   │                    mean/median/max}
│   │   ├── content_stats → {original, retweets, with_cashtags,
│   │   │                     with_hashtags, with_links,
│   │   │                     with_media, with_mentions}
│   │   ├── ai_sentiment → {scoring_system, primary_model,
│   │   │                    referee_model, posts_scored,
│   │   │                    prob_mean/std/min/max,
│   │   │                    label_3class_mean}
│   │   ├── hybrid_decision_stats
│   │   │   ├── posts_scored, posts_pos/neu/neg
│   │   │   ├── mean_score, pos/neg/neu_ratio
│   │   │   ├── primary_conf_mean, referee_conf_mean
│   │   │   └── decision_sources
│   │   │       ├── single_model (count)
│   │   │       ├── primary_default (count)
│   │   │       ├── referee_override (count)
│   │   │       └── referee_neutral_band (count)
│   │   └── sentiment_activity → {recent_posts_count,
│   │       has_recent_activity, is_silent,
│   │       latest_tweet_at, hours_since_latest_tweet}
│   │
│   └── last_2_cycles ───────────────────── same structure
│       (aggregated with SUM/AVG/MAX/MERGE semantics)
│
├── twitter_sentiment_meta ───────────────── 15 fields
│   ├── source, captured_at_utc, key_used
│   ├── cycle_id, cycle_start_utc, cycle_end_utc
│   ├── scraper_version, sentiment_model_version, lexicon_version
│   ├── is_silent, methodology_regime (v1/v2)
│   └── bucket_meta (platform, coin, date, span)
│
├── spot_prices ──────────────────────────── 700+ samples
│   └── [{ts, mid, bid, ask, spread_bps}, ...]
│       10-second intervals across full 2-hour session
│
└── diag ─────────────────────────────────── 4 fields
    ├── builder_version, build_duration_ms
    └── admission_validated, admission_validation_ts
03 The Price Array

. Enables microstructure regime detection.")

04 Sentiment Architecture
X (Twitter) posts
    → asset-specific query filtering
    → deduplication (each post scored once)
    → crypto relevance classifier (off-topic removal)
    → BERTweet primary scoring
    → confidence threshold check
        → HIGH confidence → accept primary label
        → LOW confidence → DistilBERT referee
            → agree → accept
            → disagree → referee overrides
            → uncertainty band → force neutral
    → cycle-level aggregation
    → dual time window output (last_cycle + last_2_cycles)
.")
Methodology upgrade (Phase 1 cutover: 2026-02-16T05:14:00Z): The visible shift in decision source ratios beginning February 17 reflects a phased transition to the V2 pipeline. Primary sentiment model upgraded to an improved DistilBERT variant (approximately 50% better negative-sentiment detection on crypto-labeled training data), and the referee model upgraded to a BERTweet-based architecture with better-calibrated confidence scoring. Crypto relevance filtering was activated in Phase 2 at 2026-02-17T06:03:00Z. Data produced under each methodology is marked in methodology_regime ("v1" or "v2").
.")

Hybrid dual-model architecture explained: Every sentiment prediction audit trail records which decision rule fired (decision_source). Primary default = highest-accuracy model working independently. Referee override = second model (optimized for calibration) strongly disagreed (≥0.90 confidence). Referee neutral = second model flagged ambiguity (confidence band 0.40-0.60), forcing neutral score. Reporting includes aggregates over last_cycle (most recent full query cycle, ~50-60 minutes) and last_2_cycles (aggregation of the last two query cycles).
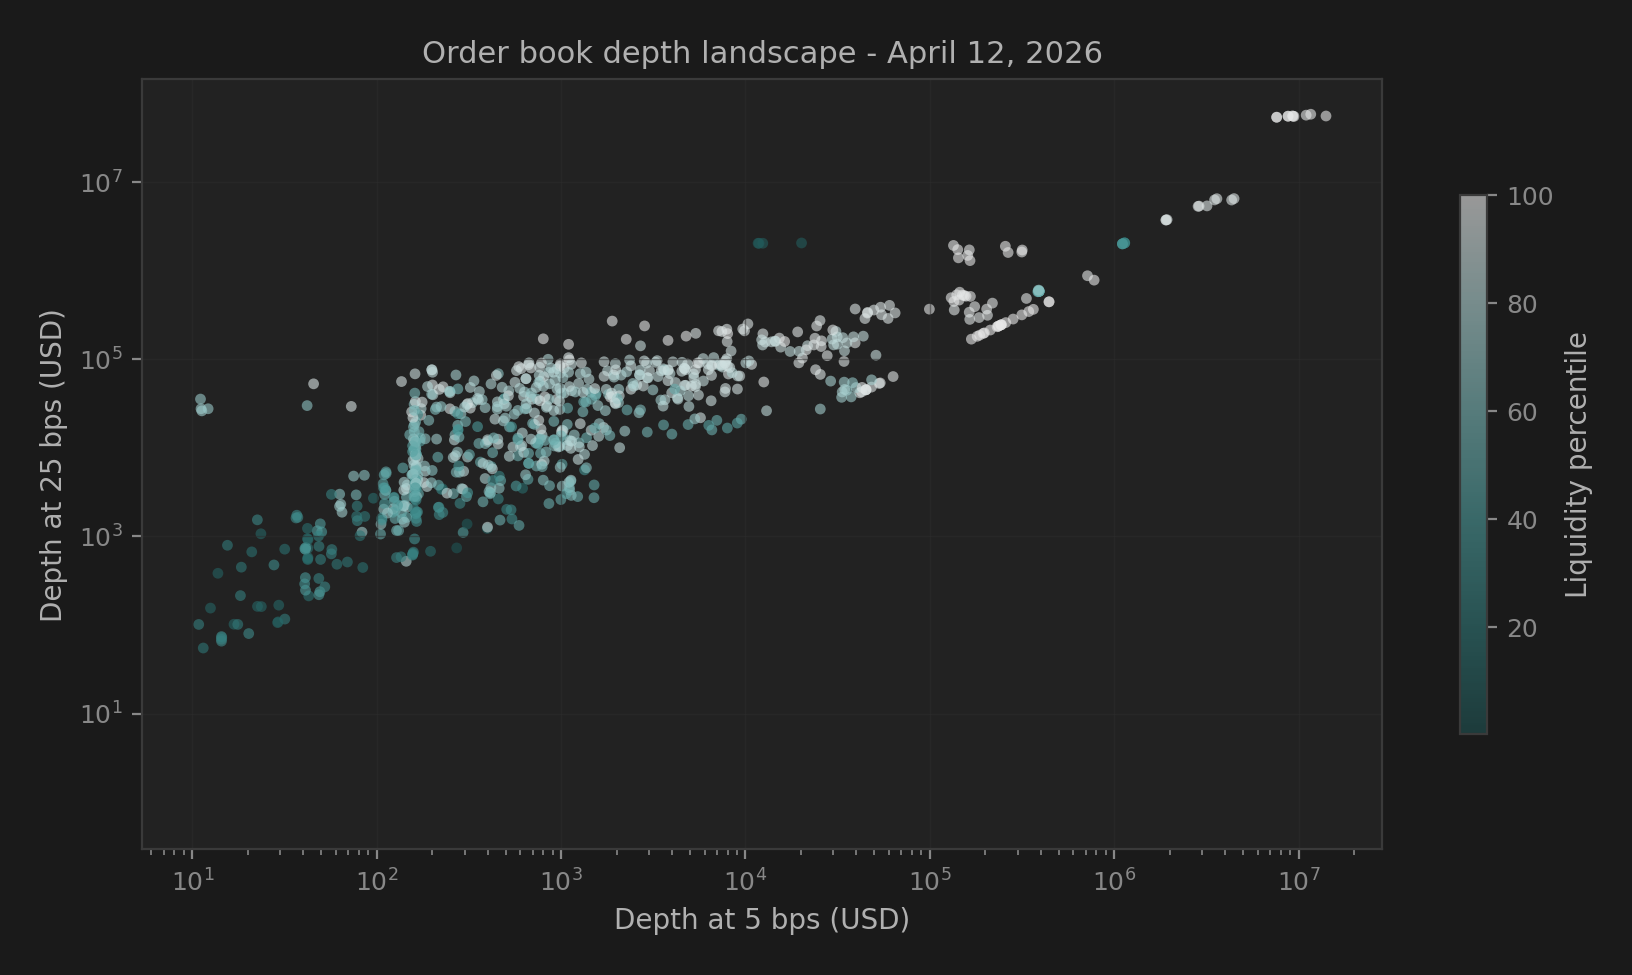
05 Market Microstructure

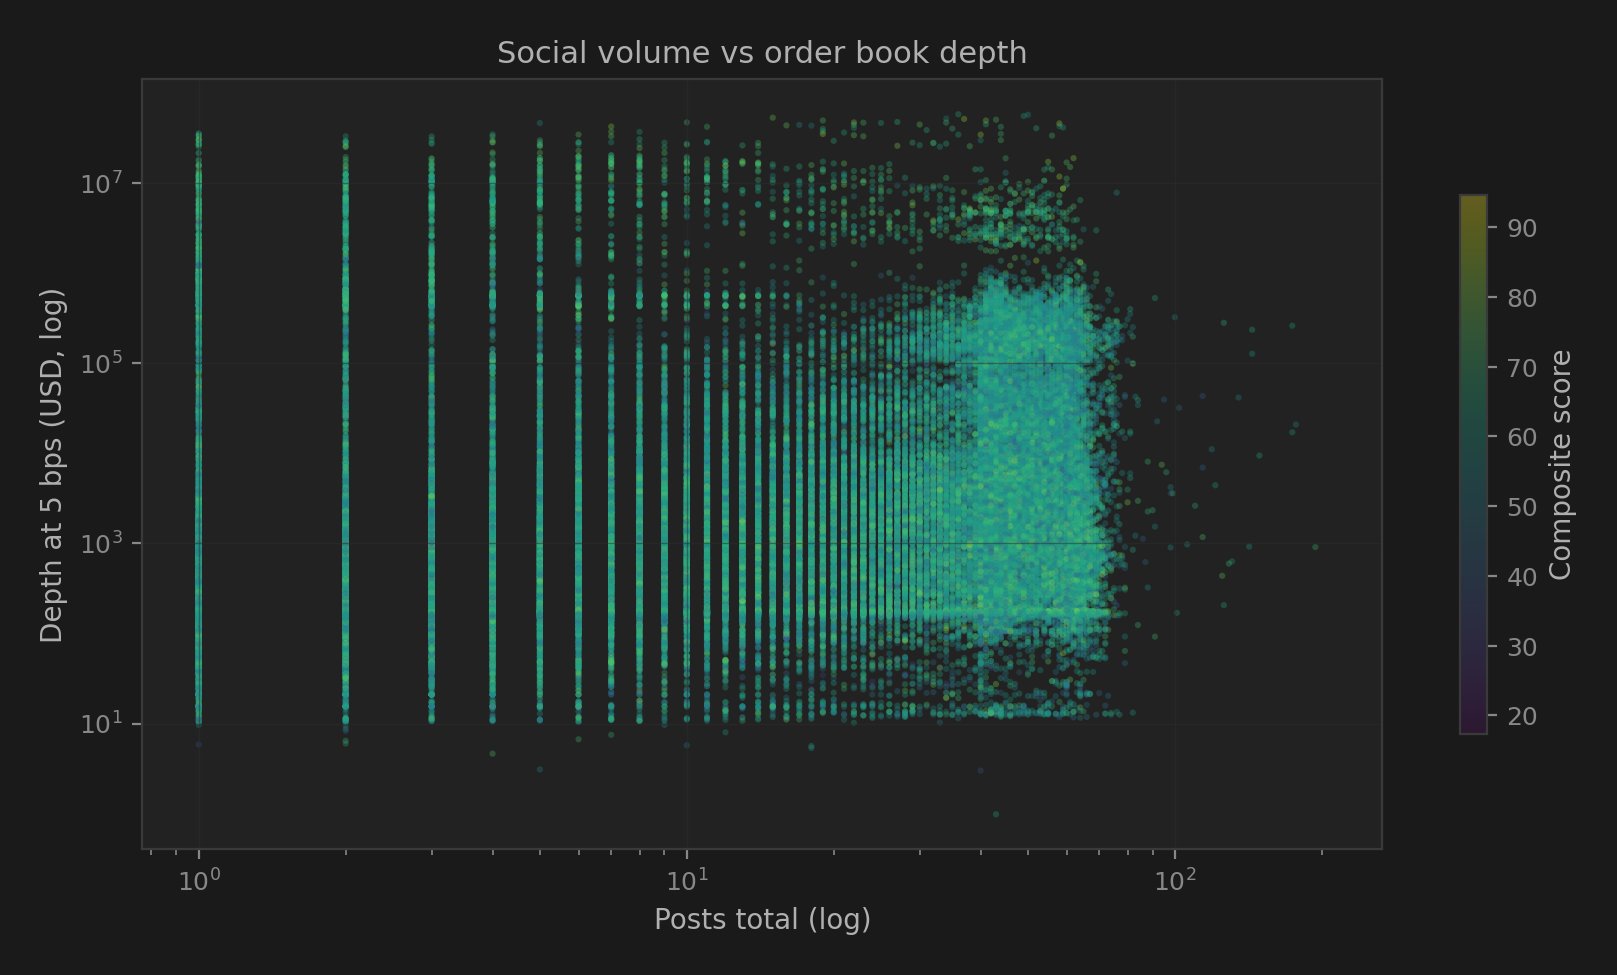
06 Cross-Domain Analysis

07 Temporal Consistency
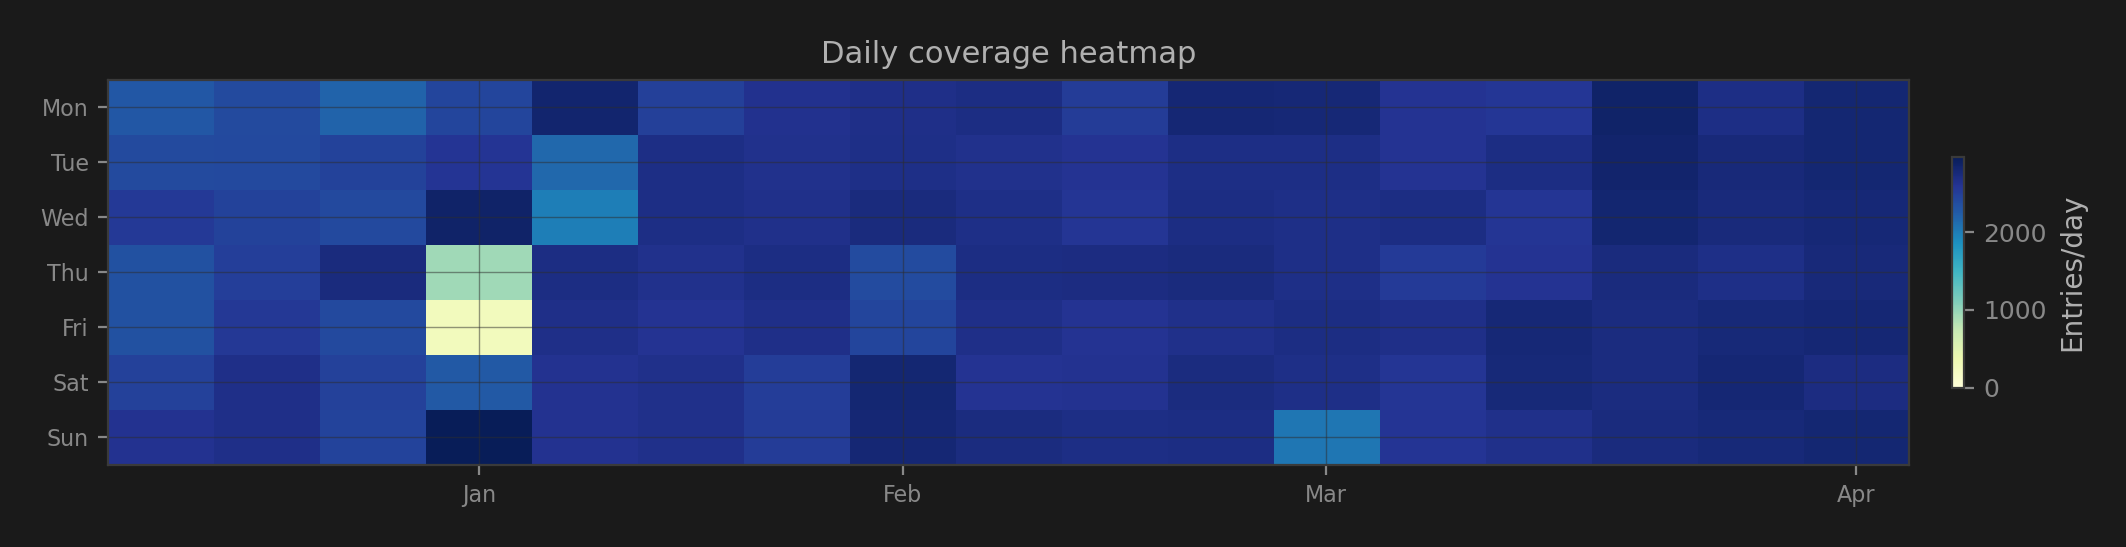
Data collection event (January 8-9): Collection volume dropped on January 8-9 during infrastructure migration of the data pipeline to a new server. Normal collection resumed January 10. Futures data for early archive entries was backfilled on January 15 using Binance's 30-day historical archive; affected rows carry futures_stale: false following the backfill.
The sentiment pipeline was upgraded from V1 (single-model DistilBERT) to V2 (dual-model BERTweet + DistilBERT referee with crypto relevance filter) in February 2026. Each row carries a methodology_regime field ("v1" or "v2") for programmatic separation.
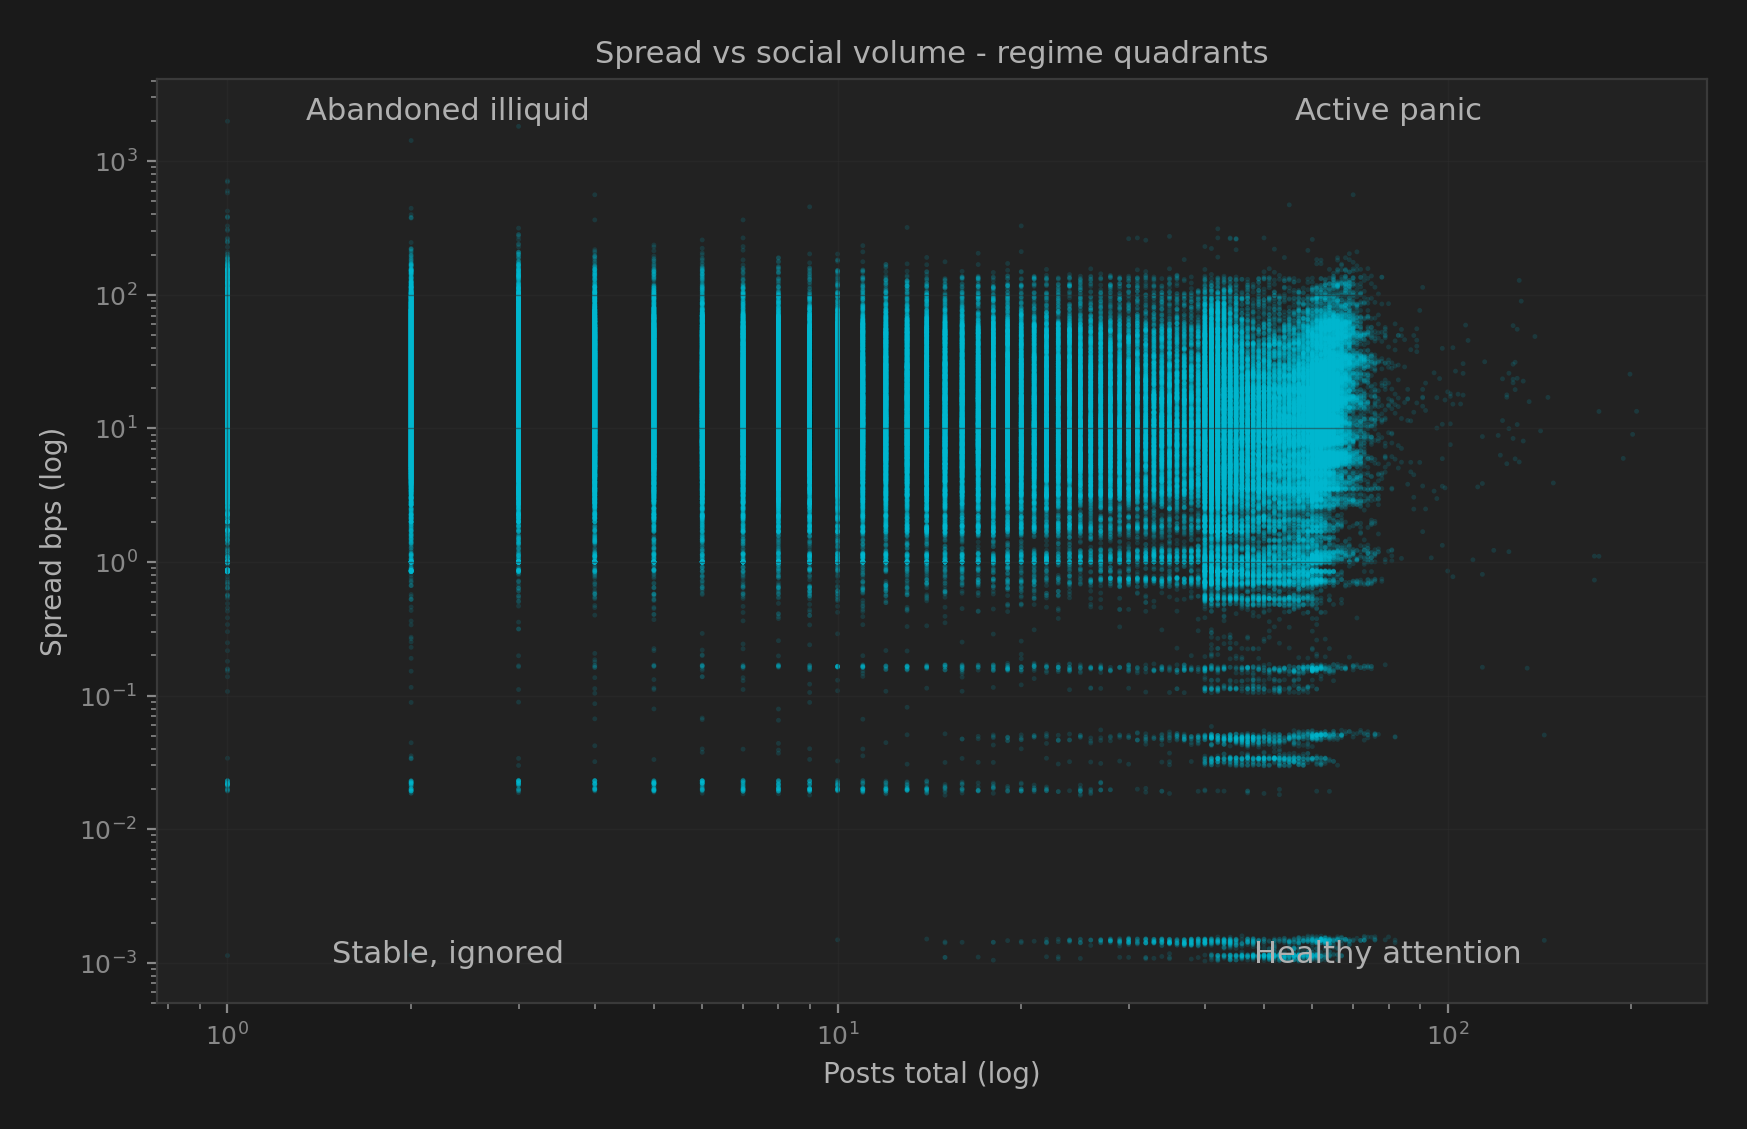
08 Tail Behavior & Stress Capture
The following observations document the range of conditions captured in the archive - from illiquid micro-caps to high-volume events - confirming the pipeline operates across the full distribution of market states.
| Category | Asset | Date | Value |
|---|---|---|---|
| Highest social volume | JUP | 2026-03-30 | 204.00 posts |
| Widest spread | DF | 2026-02-07 | 1,992 bps |
| Largest OI delta | DOLO | 2026-01-12 | 114.04 % |
| Most extreme funding | ONT | 2025-12-27 | -0.020000 per 8h |
| Highest compression | AAVE | 2025-12-15 | 50.00 score |
09 Data Quality Framework
| Flag | Type | What it indicates |
|---|---|---|
spot_data_ok | bool | Spot market data captured successfully |
futures_data_ok | bool | Futures data captured successfully |
twitter_data_ok | bool | Sentiment data captured successfully |
futures_stale | bool | Futures data older than 2× TTL (>600s) |
futures_contract_exists | bool | Asset has a USDT-M perpetual contract |
futures_contract_check_failed | bool | Contract lookup failed (API error) |
mom_fallback | bool | Momentum score used fallback calculation |
vol_fallback | bool | Volatility score used fallback calculation |
spread_fallback | bool | Spread score used fallback calculation |
compression_enabled | bool | Volatility compression detection active |
pair_bonus_applied | float | Score bonus applied (0.0–5.0) |
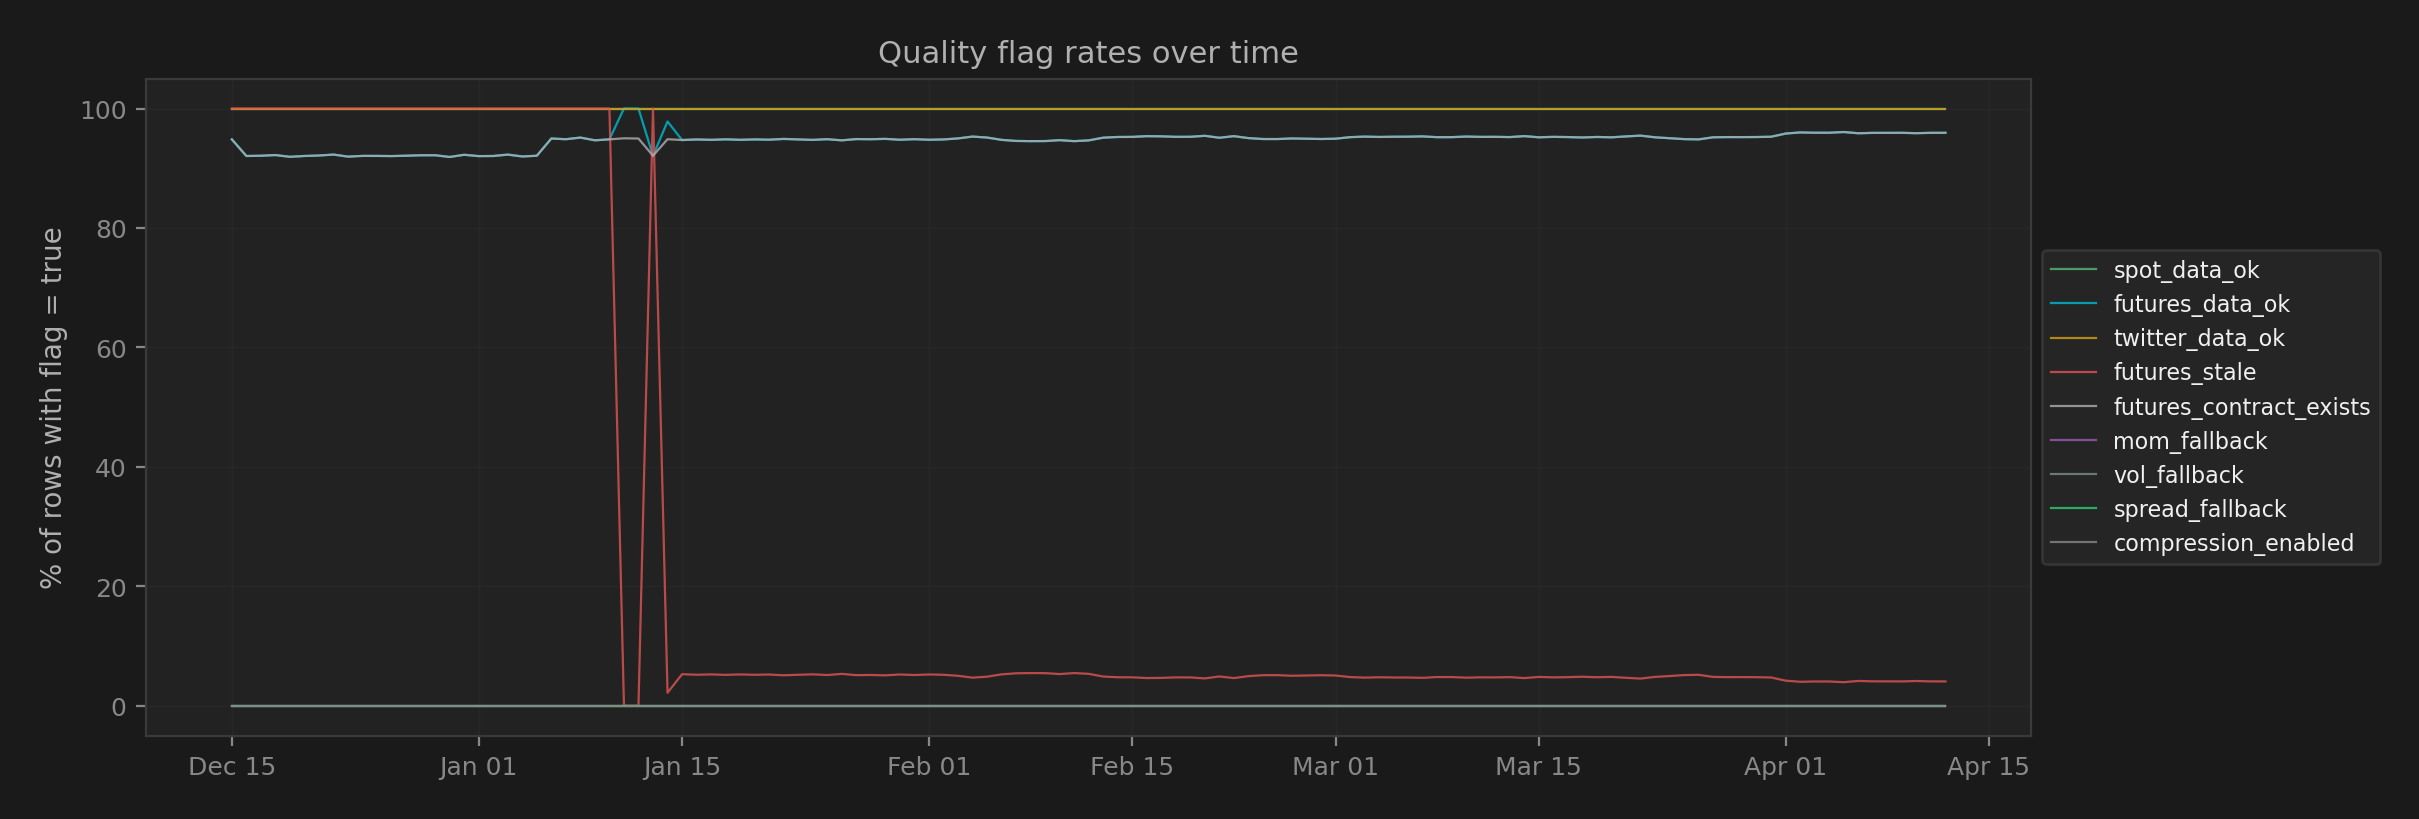
spot_data_ok AND twitter_data_ok AND NOT futures_stale),
study data quality patterns, or use flag distributions as features.
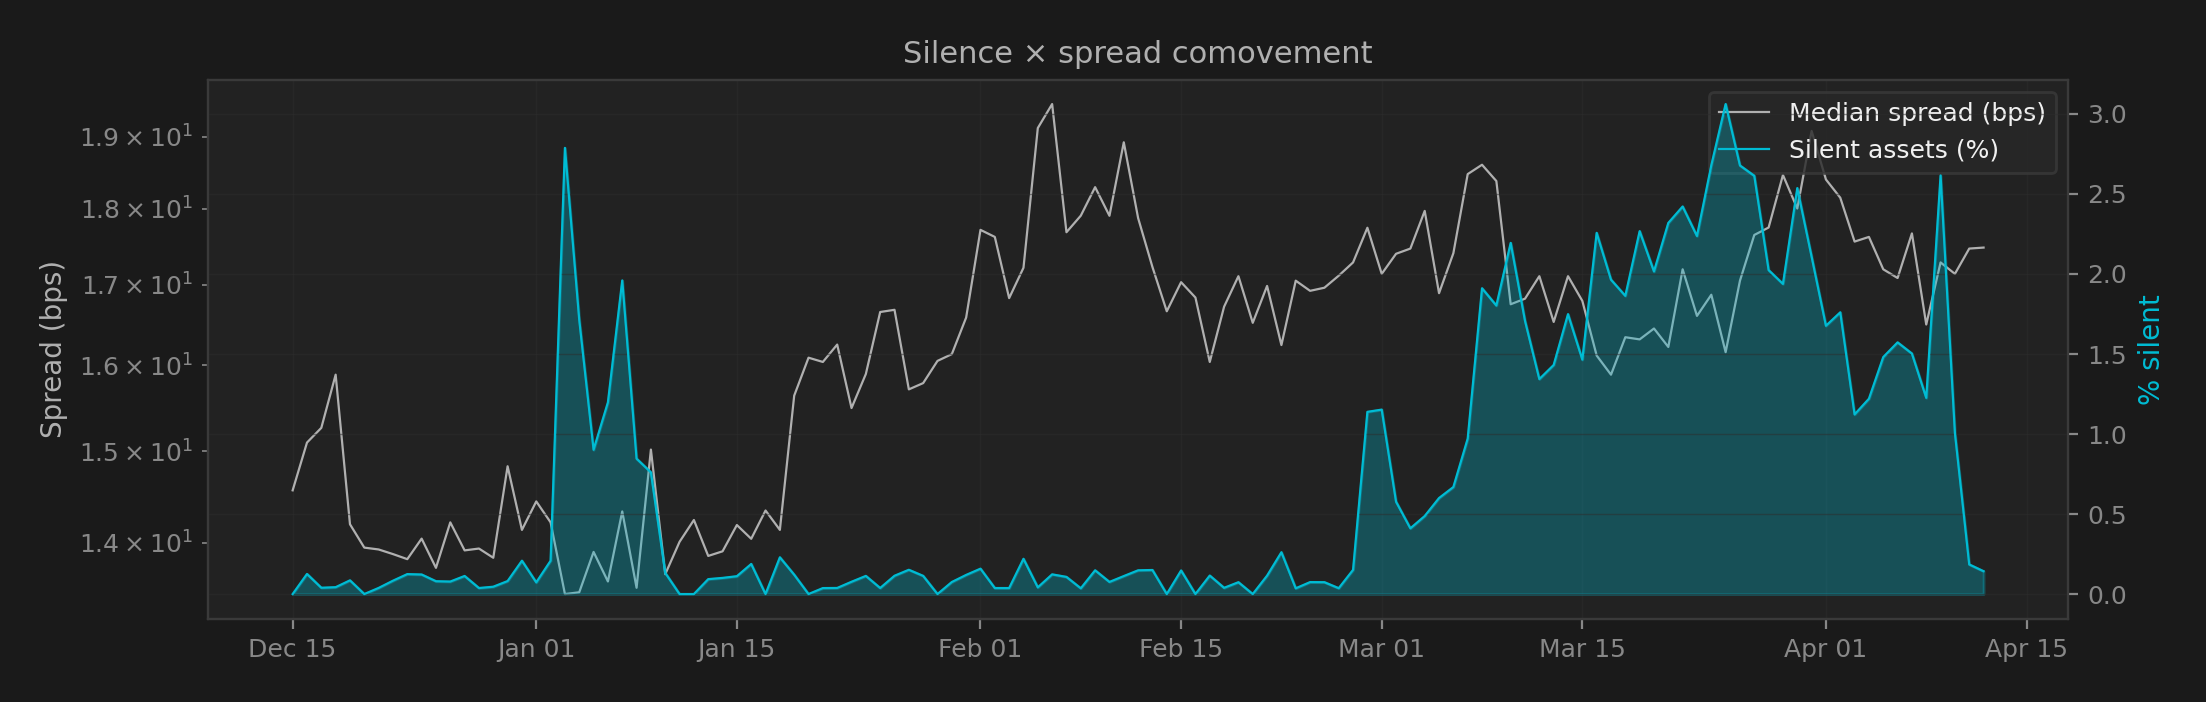
No silent data failures - if something went wrong, a flag tells you.The flag time-series
chart above shows that spot_data_ok and twitter_data_ok remain
at or near 100% across the full 80-day run.
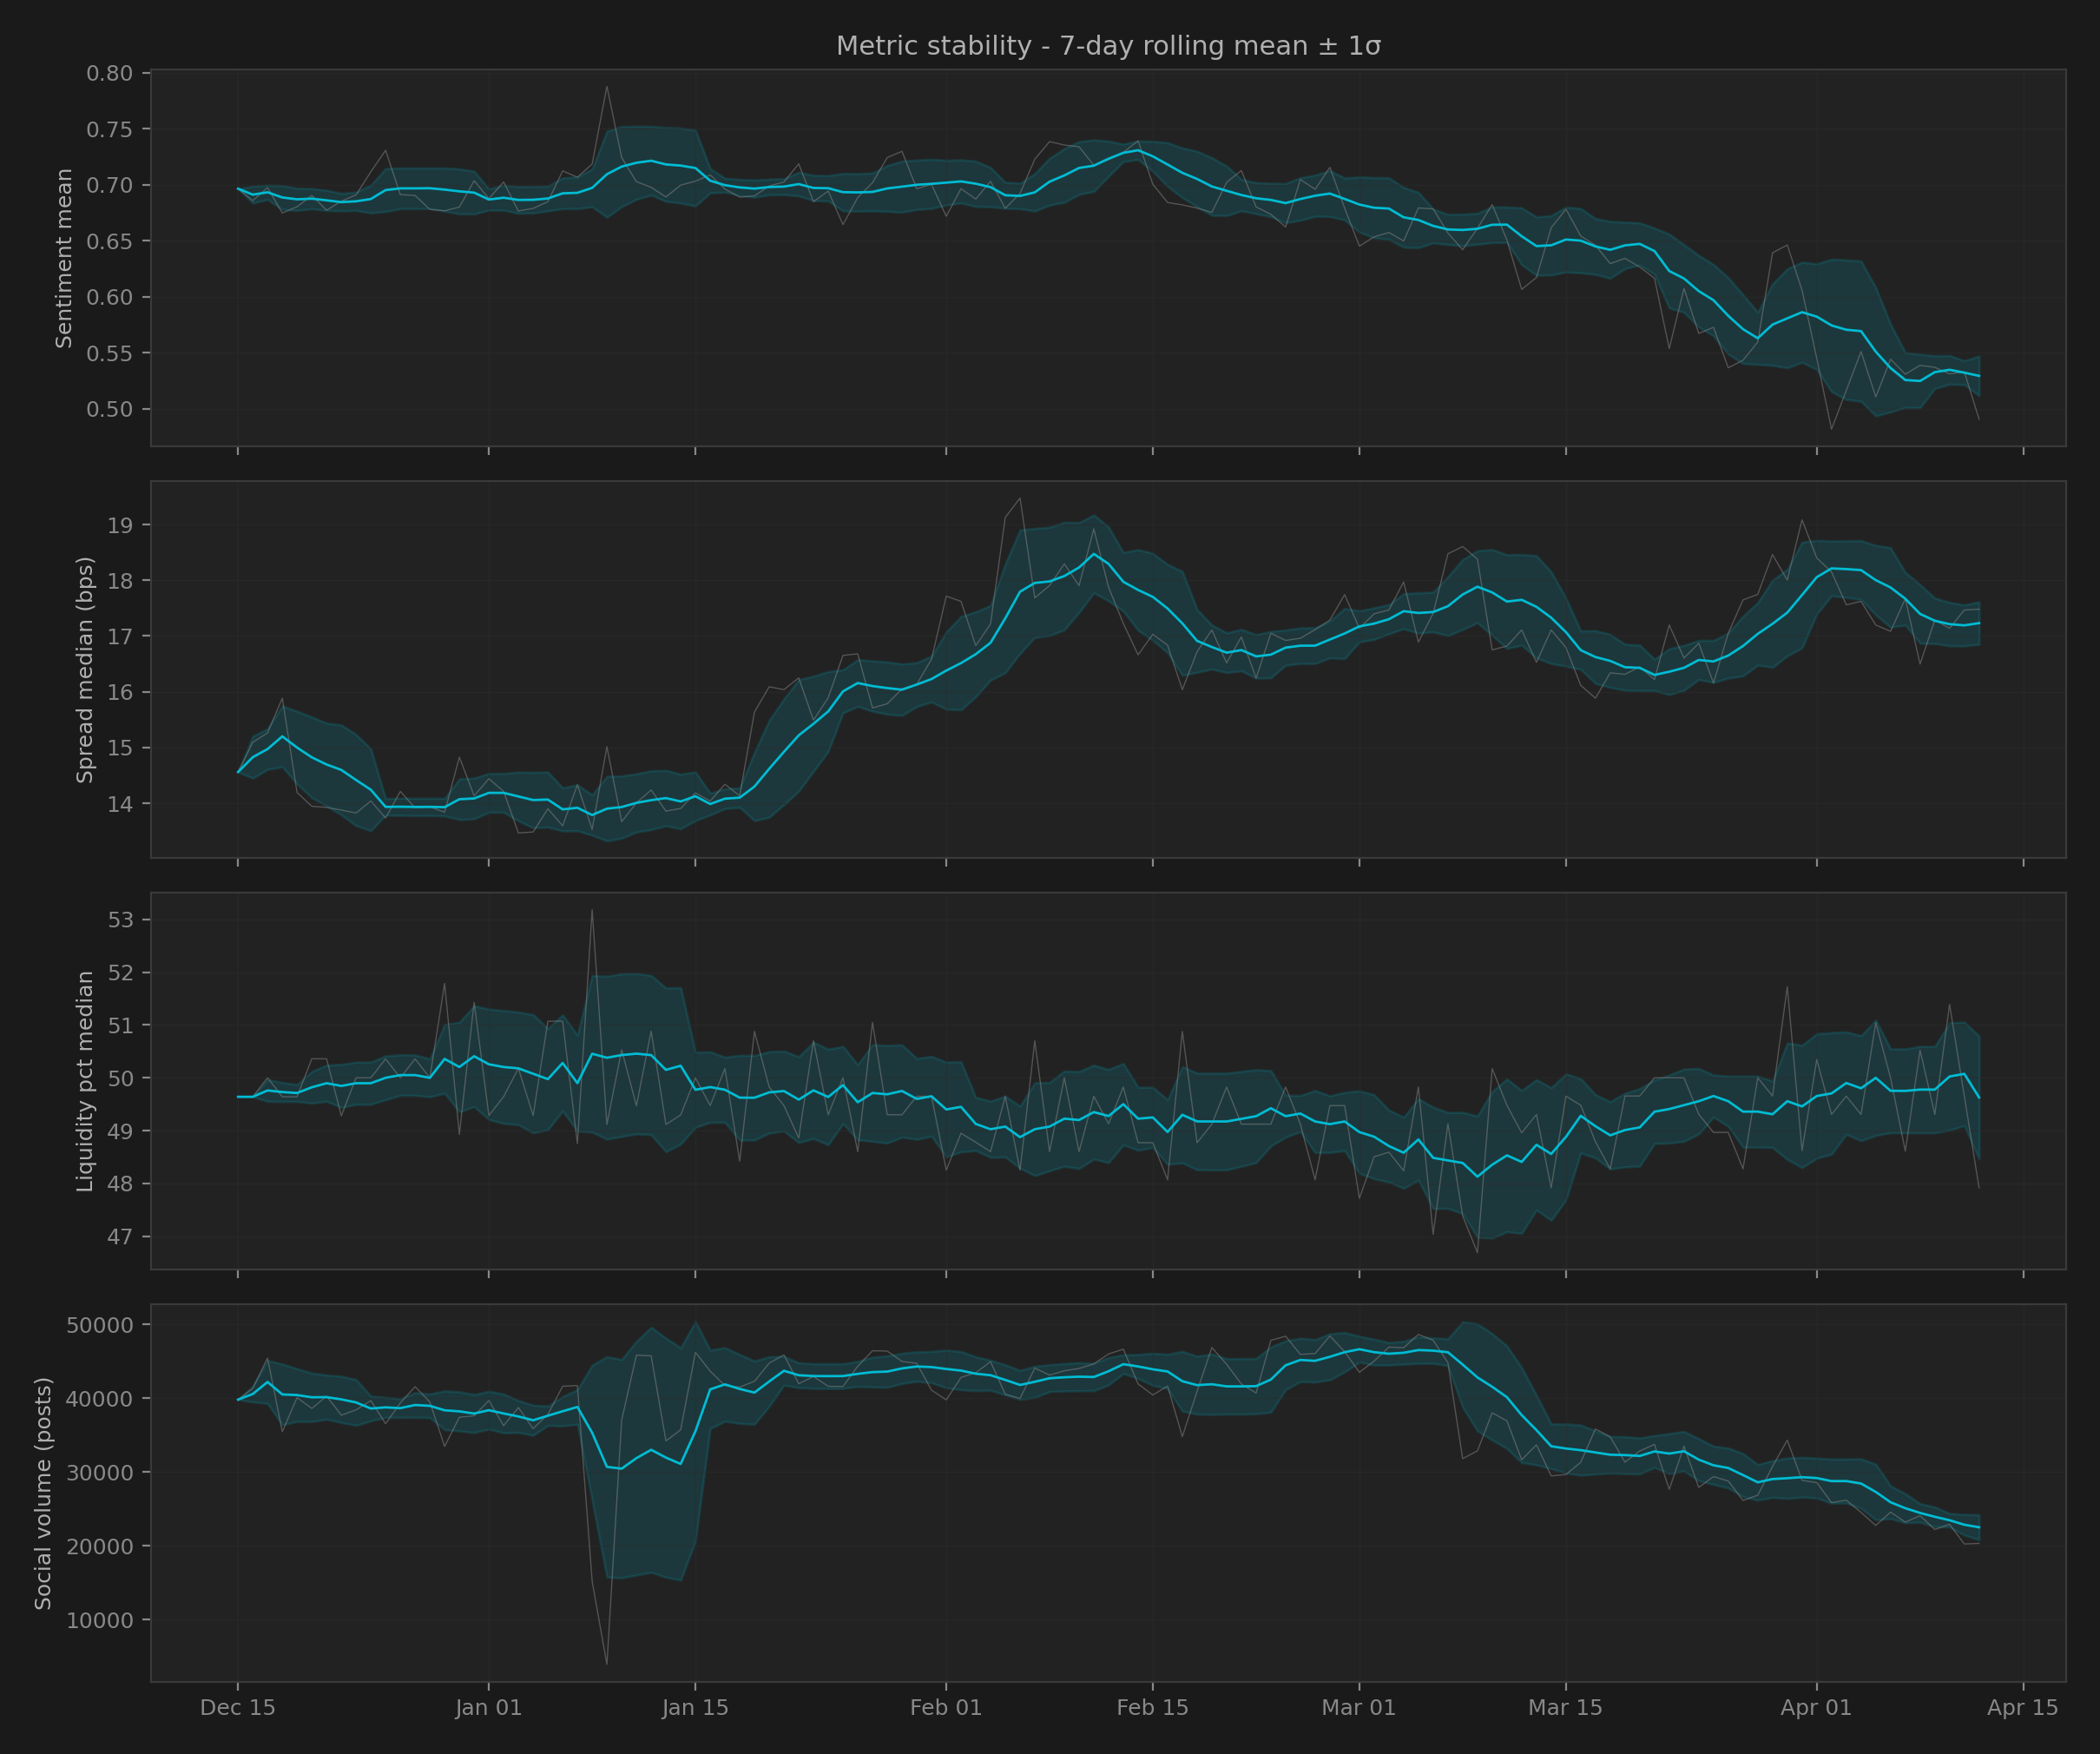
10 Statistical Properties
We conducted a systematic statistical study across all Tier 3 features against measured returns at 1-, 3-, 6-, and 12-cycle horizons. The methodology included baseline regressions, conditioned searches, and a full-feature sweep across 4,992 statistical tests with Benjamini-Hochberg FDR correction.
Unconditional sentiment relationships
Simple sentiment-to-price relationships showed no statistical significance across all horizons tested. Hybrid mean score, AI sentiment mean, lexicon score, post volume, and positive/negative ratios all returned p-values > 0.05 when tested unconditionally against subsequent measured returns.
Observed direction was consistently contrarian: elevated sentiment preceded lower measured returns. Effect sizes were modest (25–37 basis points over 24 hours).
This suggests sentiment may function as a contrarian signal under certain liquidity conditions - a hypothesis requiring out-of-sample validation.
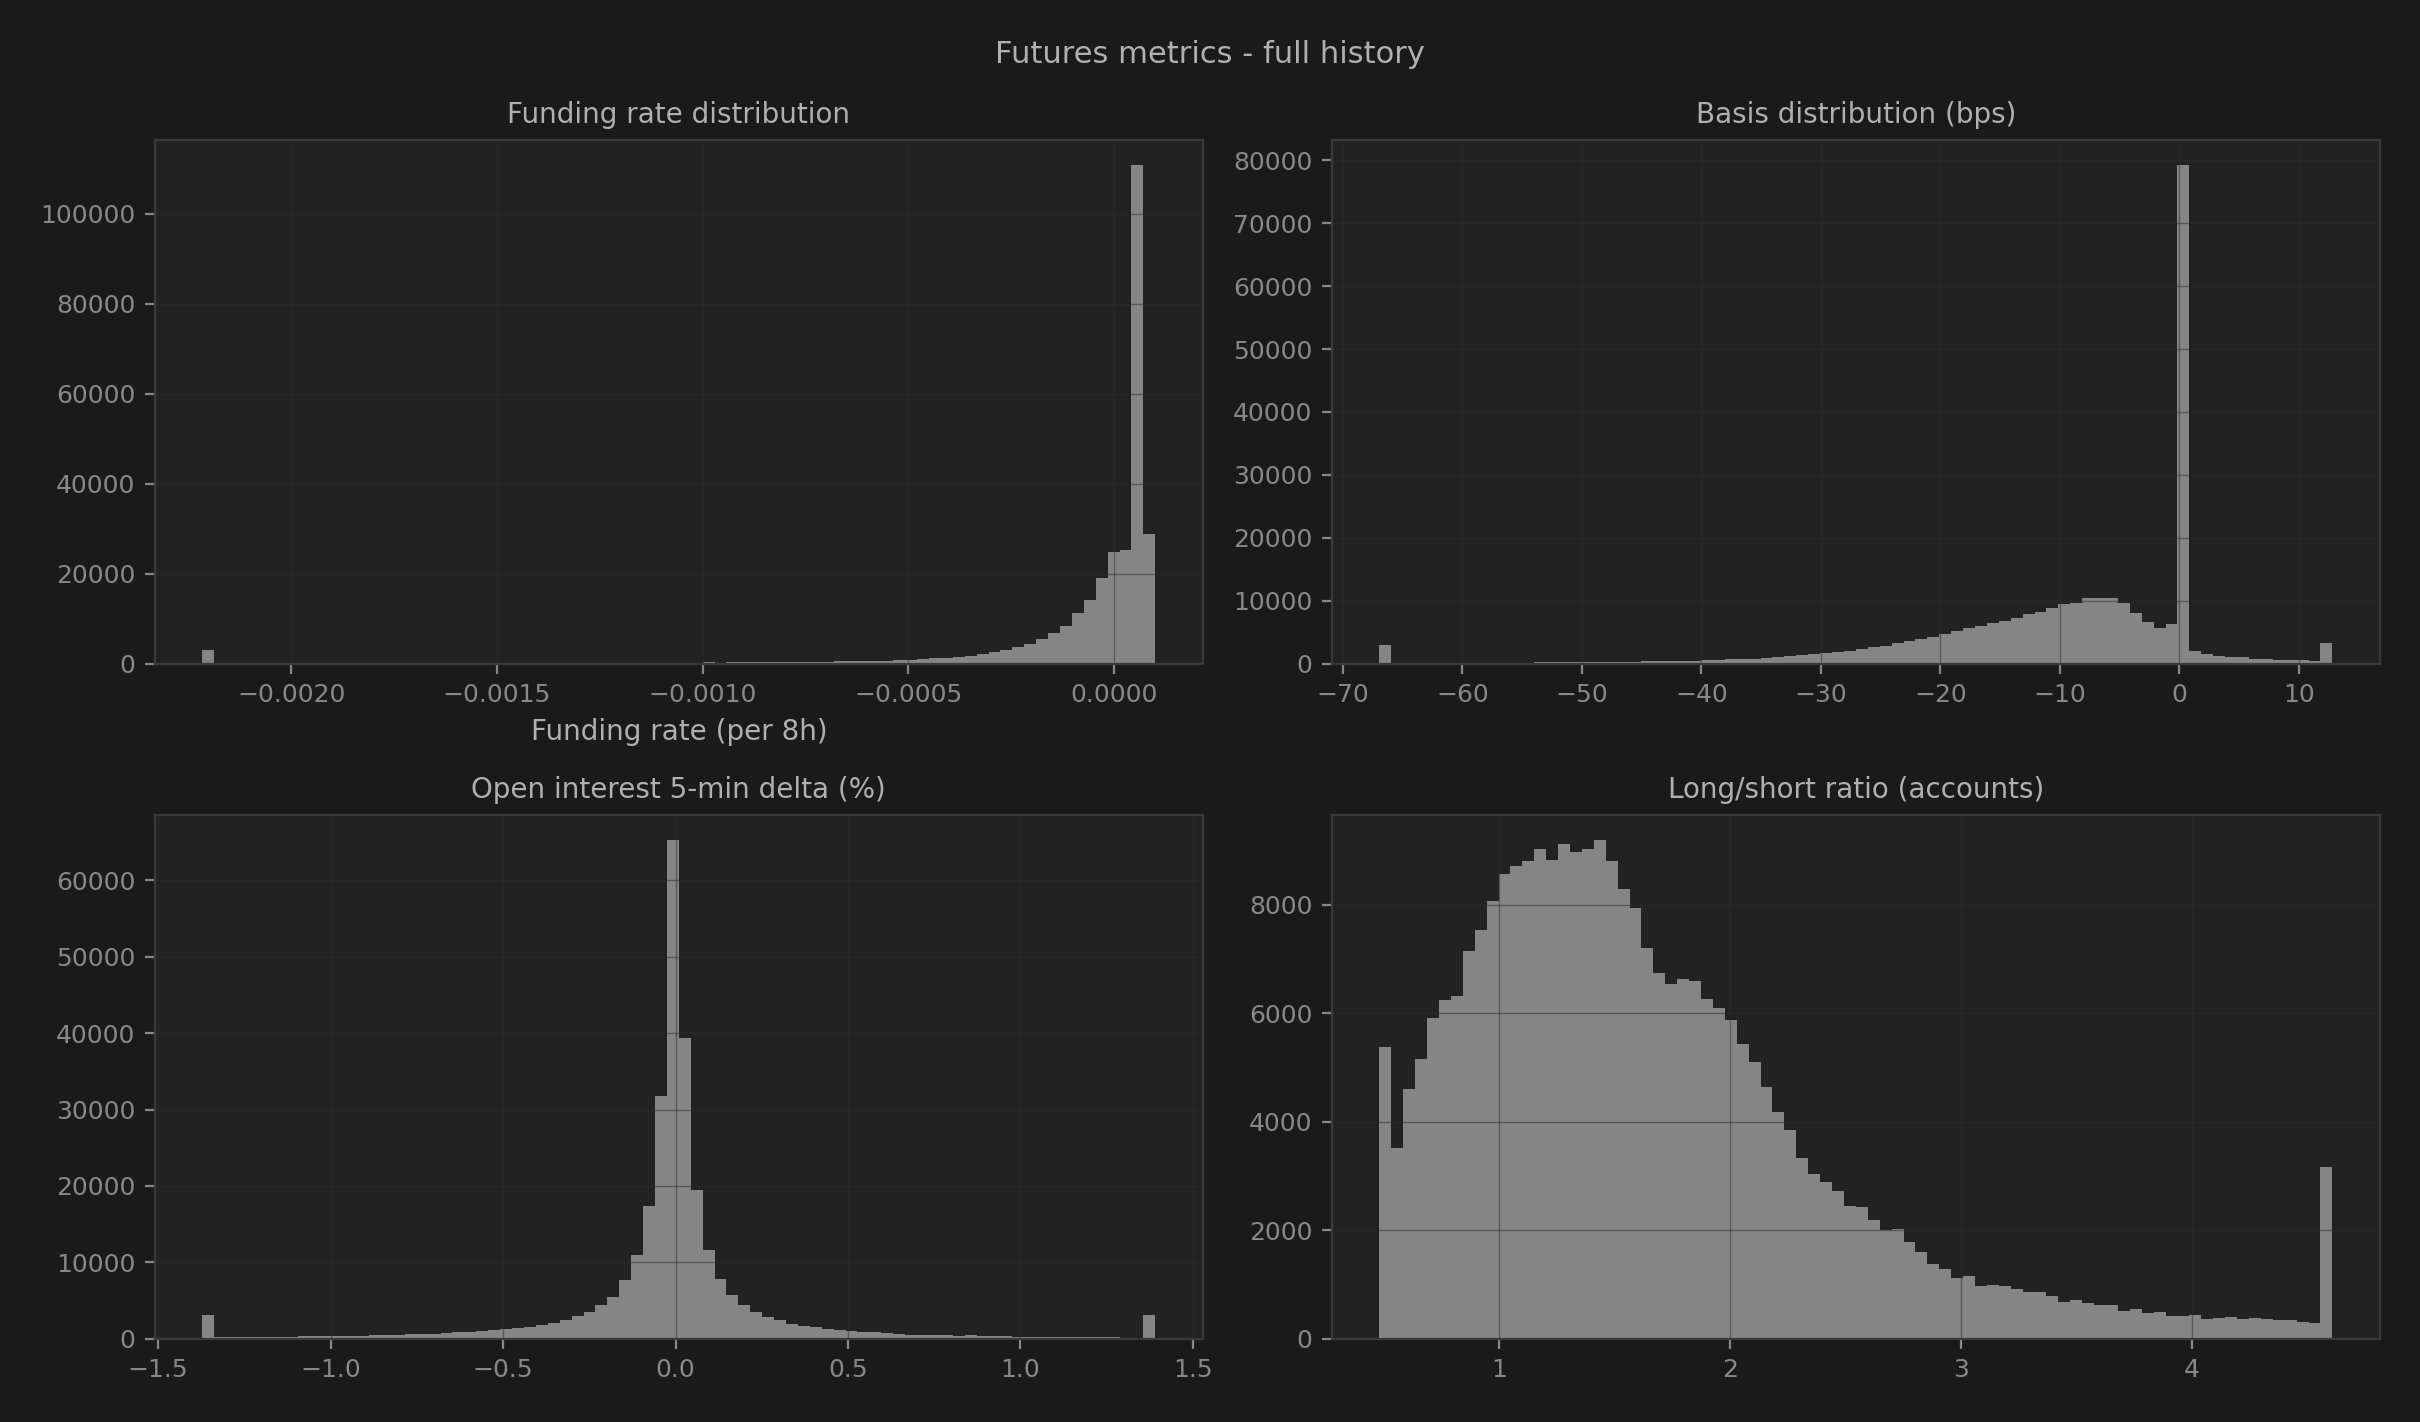
Derivatives and microstructure
The strongest statistical associations were observed in derivatives positioning and market microstructure features:
- Open interest flow: 5-minute OI deltas showed consistent associations with subsequent returns across multiple horizons
- Funding rates: Extreme funding (both positive and negative) preceded mean-reverting behavior
- Futures basis: Spot-futures divergence showed predictable convergence patterns
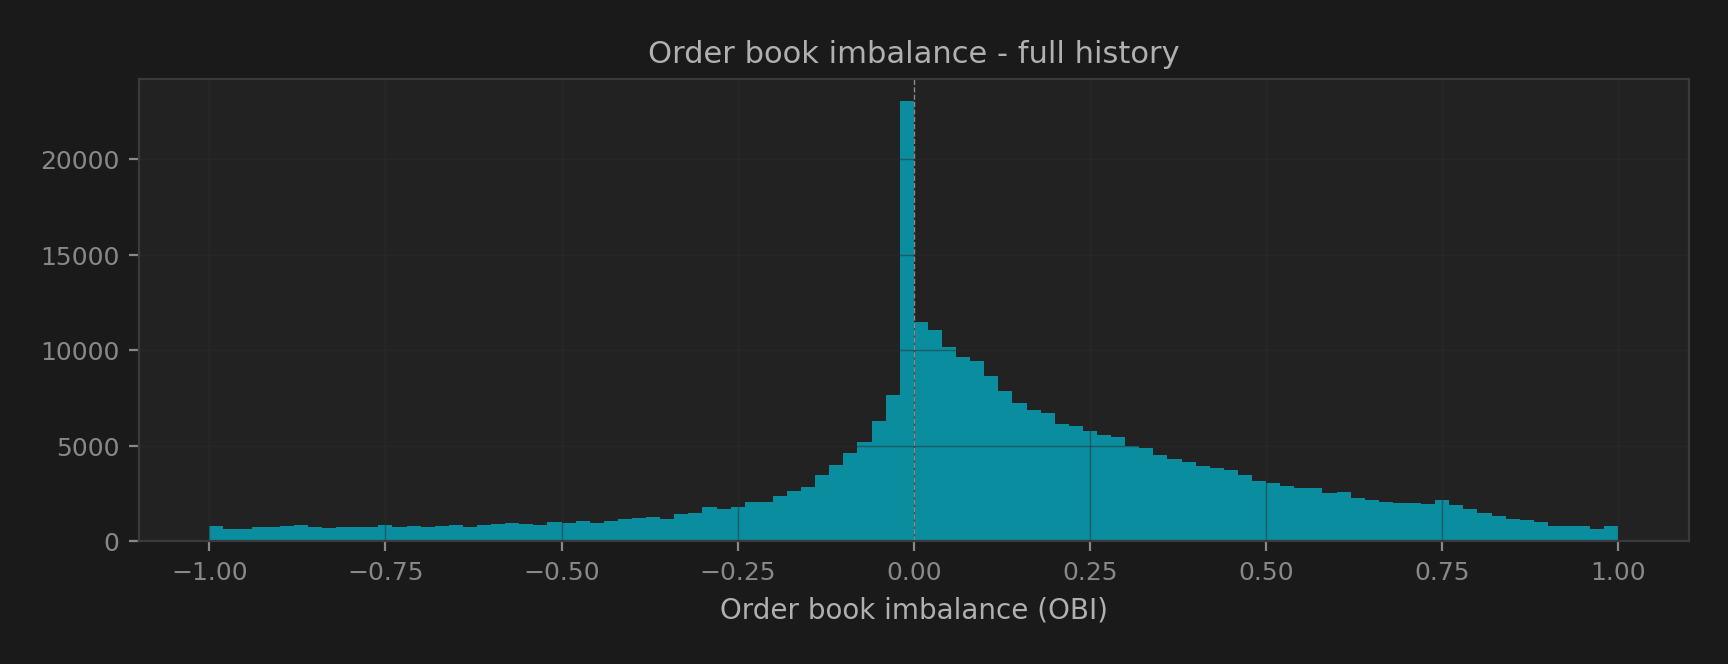
- Order book imbalance: Depth-weighted OBI at 5bps bands associated with short-horizon drift
These are well-documented market microstructure phenomena. The dataset captures them cleanly because all features share observation windows - no timestamp alignment required.
Treat these as descriptive statistics about the dataset's structure, not as evidence of exploitable patterns. Past statistical associations do not guarantee future replicability.
Full methodology: instrumetriq.com/research
11 Data Source Notes
Quote currency
Spot market data is sourced from Binance USDC pairs. Futures data is
sourced from USDT-margined perpetual contracts. Prices are functionally
identical across quote currencies (both USD stablecoins, <0.02%
difference). Order book depth and spread metrics reflect the USDC spot
market. The symbol column stores the base asset only.
Full explanation in methodology documentation.
Methodology versions
V1 (Dec 2025 – Feb 2026) used single-model DistilBERT. V2 (Feb 2026 – present) uses dual-model BERTweet + DistilBERT with crypto relevance filtering. Every row is tagged with its methodology regime.
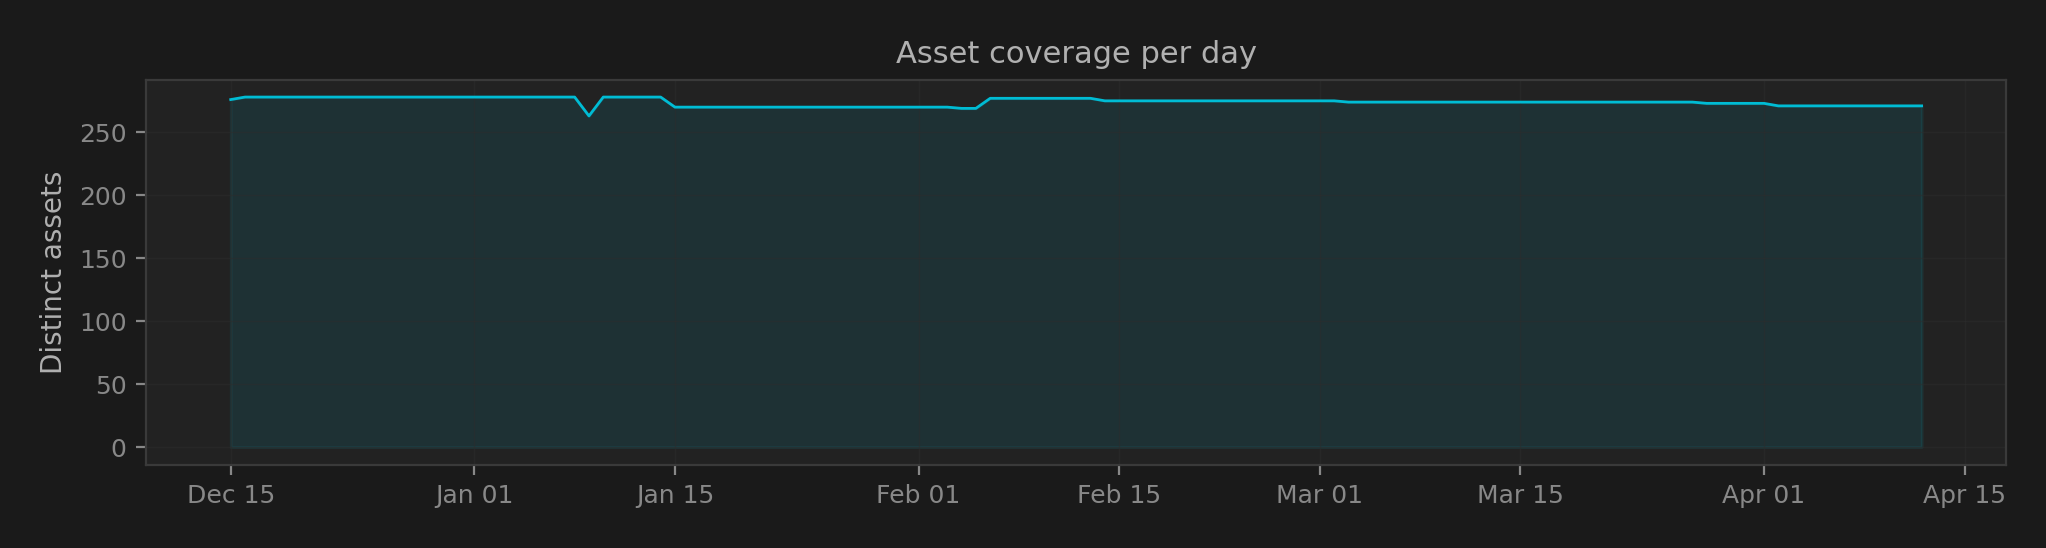
Coverage
Binance-listed USDC spot pairs + USDT-M perpetual futures. ~275 assets as of current date. Assets are added/removed automatically as Binance listings change.